Generate Reports - Project Reports
 /p>
/p>
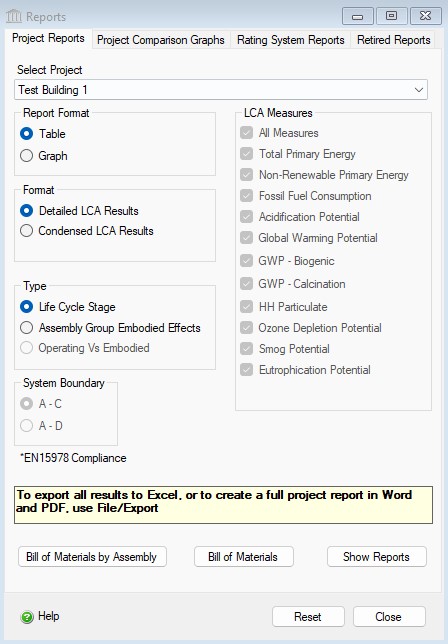
The "Reports" dialog "Project Reports" tab provides the user with options for generating one or more reports of the aggregated LCA measures (e.g. - Total Primary Energy Consumption , Non-Renewable Energy Consumption Fossil Fuel Consumption, Acidification Potential, Global Warming Potential, Human Health Particulate, Ozone Depletion Potential, Smog Potential, Eutrophication Potential) as a graph or table.
Note: The tabular reports, Detailed and Condensed LCA Results by Life Cycle Stage and Bill of Materials, can be exported to a single Excel file through the File menu Export sub-menu. You must have Microsoft Excel installed in order to export LCE Reports to Excel.
Note: The "Reports" dialog "Project Comparison Graphs " tab provides provides the user with options for generating LCA measure comparisons across a minimum of two projects up to a maximum of five open projects.
Note: The form on the "Rating System Reports" tab provides the user with options for generating one or more reports for either the Green Globes or LEED rating systems.
This dialog can be opened by selecting the "Reports" option from the main menu or by doing the following in the Tree Control Window:
- Right click one of the nodes at the Root level or one of the Projects.
- Select "Reports" from the "Project" menu. The "Reports" dialog will open to the "General" tab.
Procedure for Generating Reports:
- Select a Project
- Select a Report Format ("Graph" or "Table").
- Select a report results Format ("Detailed LCA Measures", "Condensed LCA Measures").
- Select the Report Type ("Life Cycle Stages", "Assembly Group Embodied Effects", "Operating vs Embodied").
- If the Report Format is "Graph" or the Report Type is "Assembly Group Embodied Effects", select a System Boundary ("A-C" or "A-D")
- Click on the "Bill of Materials" button to generate a "Bill of Materials" report.
- Click on the "Bill of Materials by Assembly" button to generate a "Bill of Materials by Assembly" report.
- Click on the "Show Reports" button to generate the requested report(s).
List of the Graph and Table Reports the Impact Estimator is capable of generating for each Project:
 Graphs – Life Cycle Inventory Results Table
Life Cycle Inventory Results Graphs by Assembly Group
- Air Emissions – Life Cycle Inventory Results Graph by Assembly Group - disabled in version 4.1
- Energy Consumption – Life Cycle Inventory Results Graph by Assembly Group
- Land Emissions – Life Cycle Inventory Results Graph by Assembly Group
- Water Emissions – Life Cycle Inventory Results Graph by Assembly Group - disabled in version 4.1
- Resource Use – Life Cycle Inventory Results Graph by Assembly Group
Life Cycle Inventory Results Graphs by Life Cycle Stage
- Air Emissions – Life Cycle Inventory Results Graph by Life Cycle Stage - disabled in version 4.1
- Energy Consumption – Life Cycle Inventory Results Graph by Life Cycle Stage
- Land Emissions – Life Cycle Inventory Results Graph by Life Cycle Stage
- Water Emissions – Life Cycle Inventory Results Graph by Life Cycle Stage - disabled in version 4.1
- Resource Use – Life Cycle Inventory Results Graph by Life Cycle Stage
Graphs – LCA Measures
LCA Measure Graphs by Assembly Group
- Acidification Potential – LCA Measure Graph by Assembly Group
- Global Warming Potential – LCA Measure Graph by Assembly Group
- HH Criteria – LCA Measure Graph by Assembly Group
- Ozone Depletion Potential – LCA Measure Graph by Assembly Group
- Smog Potential – LCA Measure Graph by Assembly Group
- Fossil Fuel Consumption – LCA Measure Graph by Assembly Group
- Eutrophication Potential – LCA Measure Graph by Assembly Group
LCA Measure Graphs Comparing Total Operating with Embodied Effects
Tables – Life Cycle Inventory Results Table
Life Cycle Inventory Results Tables by Assembly Group
- Air Emissions – Life Cycle Inventory Results Table by Assembly Group
- Energy Consumption – Life Cycle Inventory Results Table by Assembly Group
- Land Emissions – Life Cycle Inventory Results Table by Assembly Group
- Water Pollutants – Life Cycle Inventory Results Table by Assembly Group
- Resource Use – Life Cycle Inventory Results Table by Assembly Group
Life Cycle Inventory Results Tables by Life Cycle Stage
- Air Emissions – Life Cycle Inventory Results Table by Life Cycle Stage
- Energy Consumption – Life Cycle Inventory Results Table by ife Cycle Stage
- Land Emissions – Life Cycle Inventory Results Table by Life Cycle Stage
- Water Emissions – Life Cycle Inventory Results Table by Life Cycle Stage
- Resource Use – Life Cycle Inventory Results Table by Life Cycle Stage
Tables – LCA Measures
Note:
Starting with v5.5 (December 2023), all Life Cycle Inventory Results Tables have been discontinued, only Bill of Materials and LCA Results are available.
The available options include:
- Report Format
- Here you can specify whether you want the report to be presented as either a graph or table.
Format- Here you can specify whether you want the report results to be based on "Life Cycle Inventory Results" or "LCA Measures".
- Detailed LCA Measures
- Selecting this option will enable the "Detailed LCA Measures" section of the "Reports" dialog. You will then be able to specify which LCA measures you wish to include in the report. The Detailed LCA Measures By Life Cycle Stages report displays material and transportation effects in each life cycle stage (Modules A to D in the EN15978 Standard).
- Condensed LCA Measures
- Selecting this option will enable the "Condensed LCA Measures" section of the "Reports" dialog. You will then be able to specify which LCA measures you wish to include in the report. The Condensed LCA Measures By Life Cycle Stages report displays the same results as the Detailed LCA Measures table, but only the totals of each Stage, and is not available when the Assembly Group Embodied Effects type is chosen.
Type-
Here you can specify which type of report you want to generate.
- Life Cycle Stages
- Selecting this option displays the summary results for the selected Project to be broken into material, transportation related and annual operating effects by life cycle stage. Specifically the building life cycle stages contained in the graph include: manufacturing, construction, operations and maintenance, and end-of-life.
- Assembly Group Embodied Effects
- Selecting this option displays the results for the selected Project to be broken into envelope effects by assembly group. The report may have as many as 6 assembly groups (extra basic materials, floors, roofs, columns & beams, walls, and foundations). This graph type does not include operating energy effects.
- Operating Vs Embodied
- This option is only available when the Report Format is "Graph" and the Format is "LCA Measures". The resulting graph(s) compare the total operating energy for the building throughout its life span with the embodied energy of its materials.
System Boundary- Choose the results that you want to display or compare in the table, EN 15804/15978 modules A to C or A to D. For more details on the system boundary, click here.
LCA Measures- Here you can select one or more of the nine available LCA measures to report on including Total Primary Energy, Non-Renewable Energy, Fossil Fuel Consumption, Acidification Potential, Global Warming Potential, HH Particulate, Ozone Depletion Potential, Smog Potential, Eutrophication Potential. For Tables, all LCA Measures will automatically be chosen, for Graphs, the user can choose individual LCA Measures to display.
Bill of Materials Button- Selecting this button will open result in the Bill of Materials report being generated.
Bill of Materials by Assembly Button- Selecting this button will open results in the Bill of Materials by Assembly report being generated.
Show Reports Button- Selecting this button will result in the requested report format and content to be generated for each of the LCA measures or LCI category options that you selected.
Reset Button- Selecting this button will cause the "Reports" dialog "General" tab form options to be reset to their default state.
Close Button- Selecting this button will close the "Reports" dialog.