Report - Graph - Global Warming Potential– LCA Measure Graph Comparing the Global Warming Potential due to Total Operating Energy with Global Warming Potential due to Embodied Energy
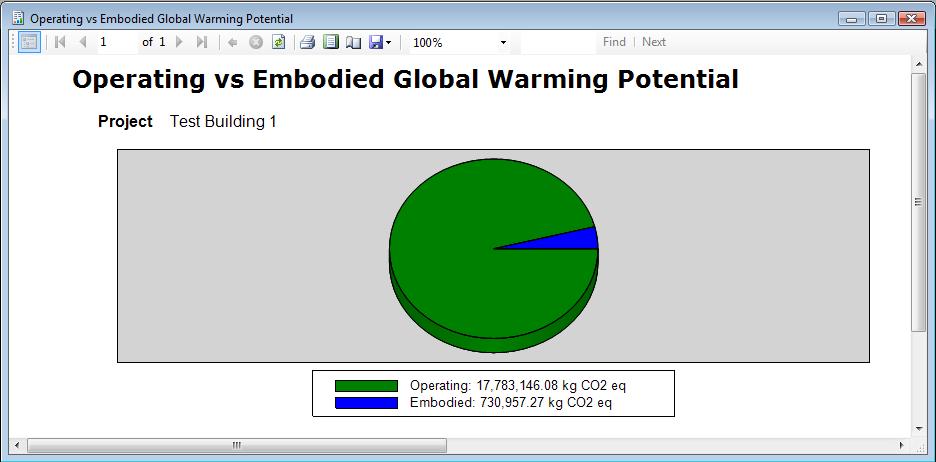
This piechart shows the life cycle Global Warming Potential for the Embodied Energy versus Global Warming Potential due to Total Operating Energy for the life of the project.
Definitions
- Operating:
- Consists of the total amount of Global Warming Potential due to operating energy over the entire building life.
Embodied:- Consists of the total amount of Global Warming Potential from the five life cycle stages of the building: manufacturing, construction, operation, maintenance, and end-of-life, excluding operating energy effects.
All Table and Graph reports use a "Report Viewer", that has a common toolbar. Each member of the common toolbar is detailed in the "Report Toolbar" page.