Generate Reports
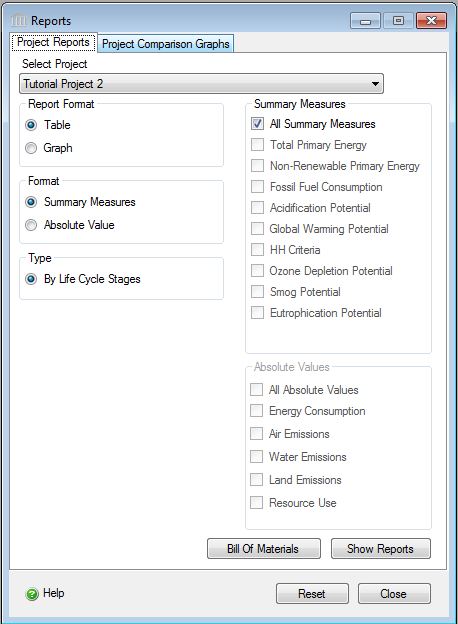
The "Reports" dialog "General" tab provides the user with options for generating one or more reports using either the absolute inventory results or the eight aggregated summary impact measures (e.g. - Total Primary Energy, Non-Renewable Primary Energy, Fossil Fuel Consumption, Air Acidification, Global Warming Potential, Human Health Criteria, Ozone Depletion Potential, Smog Potential, Eutrophication Potential ) as a graph or table.
The results for each report are generated on a project level and includes the results of all roadway assemblies and extra basic materials that are included in the project that is selected in the drop down box at the top of the Reports dialog box. If a user has two or more roadway assemblies in the same project, he/she can not separate and view the results of each assembly. If the user wants to see the results of each separate roadway assembly, they need to copy each assembly into a separate new project for each, then compare the results of the new projects.
Note: The "Reports" dialog "Comparison Graphs " tab provides provides the user with options for generating summary measure comparisons across a minimum of two projects up to a maximum of five open projects.
This dialog can be opened by selecting the "Reports" option from the main menu or by doing the following in the Tree Control Window:
- Right click one of the nodes at the Root level or one of the Projects.
- Select "Reports" from the "Project" menu. The "Reports" dialog will open to the "General" tab.
Procedure for Generating Reports:
- Select a Project
- Select a Report Format ("Graph" or "Table").
- Select a report results Format ("Absolute Values" or "Summary Measures").
- Select the Report Type ("Life Cycle Stages").
- Select the "Summary Measure" effects or "Absolute Values" effects.
- Click on the "Bill of Materials" button to generate a "Bill of Materials" report.
- Click on the "Show Reports" button to generate the requested report(s).
All Table and Graph reports use a "Report Viewer", that has a common toolbar. Each member of the common toolbar is detailed in the "Report Toolbar" page.
Printing Reports:
All reports are designed to work on one of the following paper sizes:
- Letter (8.5" x 11")
- Legal (8.5" x 14")
- Tabloid (11" x 14")
Procedure for printing a report that is sized for Tabloid size paper on Legal or Letter sized paper
- Export the report to PDF
- Open the PDF file in Adobe Acrobat
- Click on the "Print" button (or select File -> Print) to launch the following "Print" dialog:
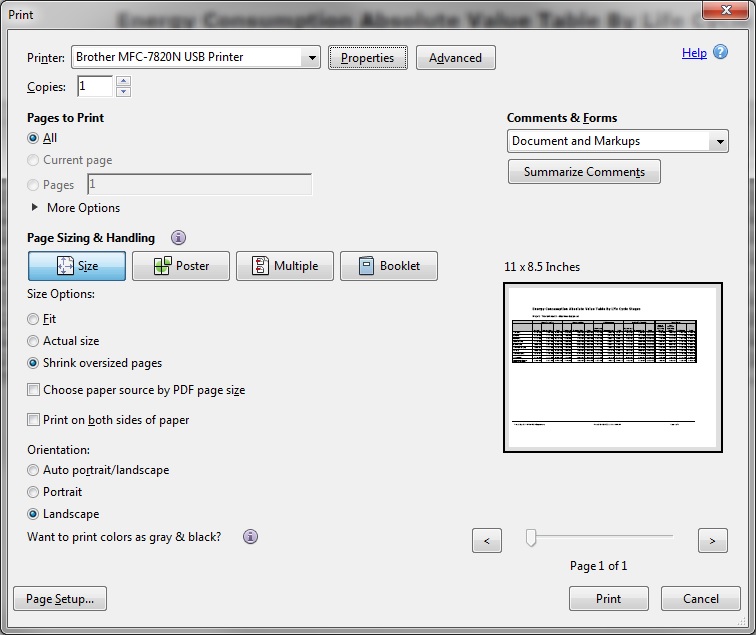
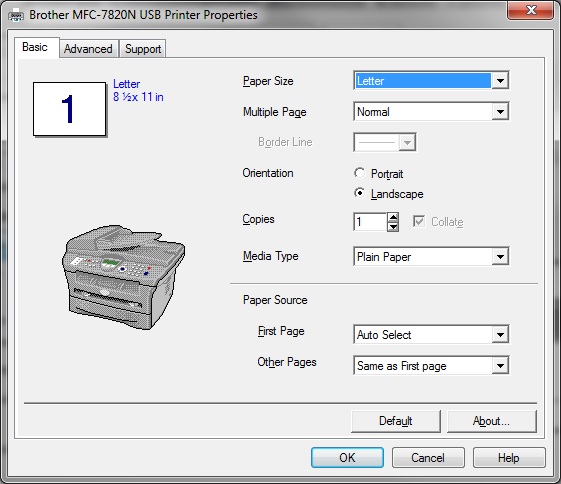
- Click on the printer "Properies" and select the appropriate page size for your printer (e.g., Letter, Legal, etc.). Click the "OK" button.
- For "Size Options", select "Shrink oversized pages". The "Fit" option should work when printing to a paper size that is larger than the default report page size.
- For "Orientation", select "Landscape"
- Click the "OK" button to print the report.
List of the Graph and Table Reports the Pavement LCA is capable of generating for each Project:
 Graphs – Absolute Values
Absolute Value Graphs by Assembly Group
- Air Emissions – Absolute Value Graph by Assembly Group - disabled in version 4.1
- Energy Consumption – Absolute Value Graph by Assembly Group
- Land Emissions – Absolute Value Graph by Assembly Group
- Water Emissions – Absolute Value Graph by Assembly Group - disabled in version 4.1
- Resource Use – Absolute Value Graph by Assembly Group
Absolute Value Graphs by Life Cycle Stage
- Air Emissions – Absolute Value Graph by Life Cycle Stage - disabled in version 4.1
- Energy Consumption – Absolute Value Graph by Life Cycle Stage
- Land Emissions – Absolute Value Graph by Life Cycle Stage
- Water Emissions – Absolute Value Graph by Life Cycle Stage - disabled in version 4.1
- Resource Use – Absolute Value Graph by Life Cycle Stage
Graphs – Summary Measures
Summary Measure Graphs by Assembly Group
- Acidification Potential – Summary Measure Graph by Assembly Group
- Global Warming Potential – Summary Measure Graph by Assembly Group
- HH Criteria – Summary Measure Graph by Assembly Group
- Ozone Depletion Potential – Summary Measure Graph by Assembly Group
- Smog Potential – Summary Measure Graph by Assembly Group
- Fossil Fuel Consumption – Summary Measure Graph by Assembly Group
- Eutrophication Potential – Summary Measure Graph by Assembly Group
- Weighted Resource Use – Summary Measure Graph by Assembly Group
Summary Measure Graphs by Life Cycle Stage
- Acidification Potential – Summary Measure Graph by Life Cycle Stage
- Global Warming Potential – Summary Measure Graph by Life Cycle Stage
- HH Criteria – Summary Measure Graph by Life Cycle Stage
- Ozone Depletion Potential – Summary Measure Graph by Life Cycle Stage
- Smog Potential – Summary Measure Graph by Life Cycle Stage
- Fossil Fuel Consumption – Summary Measure Graph by Life Cycle Stage
- Eutrophication Potential – Summary Measure Graph by Life Cycle Stage
- Weighted Resource Use – Summary Measure Graph by Life Cycle Stage
Summary Measure Graphs Comparing Total Operating with Embodied Effects
Tables – Absolute Values
Absolute Values Tables by Assembly Group
- Air Emissions – Absolute Values by Assembly Group
- Energy Consumption – Absolute Values by Assembly Group
- Land Emissions – Absolute Values by Assembly Group
- Water Pollutants – Absolute Values by Assembly Group
- Resource Use – Absolute Values by Assembly Group
Absolute Values Tables by Life Cycle Stage
Tables – Summary Measures
Note:
The column values on the Absolute Value graphs for Air Emissions and Water Emissions are unreadable due to the large number of different air and water emissions. These graphs have been disabled for the Version 1.0 release. Users are advised to use the Table version of these reports.
The available options include:
- Report Format
- Here you can specify whether you want the report to be presented as either a graph or table.
Format- Here you can specify whether you want the report results to be based on "Absolute Values" or "Summary Measures".
- Absolute Value
- Selecting this option will enable the "Absolute Values" section of the "Reports" dialog. You will then be able to specify which absolute values you wish to include in the report.
- Summary Measures
- Selecting this option will enable the "Summary Measures" section of the "Reports" dialog. You will then be able to specify which summary measures you wish to include in the report.
Type-
Here you can specify which type of report you want to generate.
- Life Cycle Stages
- Selecting this option displays the summary results for the selected Project to be broken into material, transportation related and annual operating effects by life cycle stage. Specifically the roadway life cycle stages contained in the graph include: manufacturing, construction, operations and maintenance, and end-of-life.
- Assembly Group Embodied Effects
- Selecting this option displays the results for the selected Project to be broken into effects by assembly group. The report may have as many as 6 assembly groups (extra basic materials, floors, roofs, columns & beams, walls, and foundations). This graph type does not include operating energy effects.
- Operating Vs Embodied
- This option is only available when the Report Format is "Graph" and the Format is "Summary Measures". The resulting graph(s) compare the total operating energy for the roadway project throughout its life span with the embodied energy of its materials.
Summary Measures- Here you can select one or more of the eight available summary measures to report on including Total Primary Energy, Non-Renewable Primary Energy, Fossil Fuel Consumption, Air Acidification, Global Warming Potential, Human Health Criteria, Ozone Depletion Potential, Smog Potential, Eutrophication Potential.
Absolute Values- Here you can selected one or more of the five absolute value options to report on including Energy Consumption, Air Emissions, Water Emissions, Land Emissions, and Resource Use.
Bill of Materials Button- Selecting this button will open result in the Bill of Materials report being generated.
Show Reports Button- Selecting this button will result in the requested report format and content to be generated for each of the summary measures or absolute value options that you selected.
Reset Button- Selecting this button will cause the "Reports" dialog "General" tab form options to be reset to their default state.
Close Button- Selecting this button will close the "Reports" dialog.