Generate Reports - Multi-Project Comparison Graphs
The "Reports" dialog "Comparison Graphs " tab provides provides the user with options for generating summary measure comparisons across a minimum of two projects up to a maximum of five open projects.
The results for each report are generated on a project level and includes the results of all roadway assemblies and extra basic materials that are included in the project that is selected in the drop down box at the top of the Reports dialog box. If a user has two or more roadway assemblies in the same project, he/she can not separate and view the results of each assembly. If the user wants to see the results of each separate roadway assembly, they need to copy each assembly into a separate new project for each, then compare the results of the new projects.
Note: The "Reports" dialog "General" tab provides the user with options for generating one or more reports using either the absolute inventory results or the eight aggregated summary impact measures (e.g. - Fossil Fuel Consumption, Air Acidification, Global Warming Potential, Human Health Criteria, Ozone Depletion Potential, Smog Potential, Eutrophication Potential) as a graph or table.
The Pavement LCA is equipped with a separate utility for comparing the results of two or more (up to a maximum of 5) open project designs across the seven summary measures. From a reporting perspective, all Pavement LCA results are compiled and accessed at the project level. So if you are interested in comparing two or more assemblies, rather than complete designs, you must input each assembly you want to compare as an individual project.
Comparison graphs are only available for Summary Measures, if the user wants to compare Absolute Value results (Energy Consumption, Resource Use, or Air, Water and Land Emissions), he/she must export the Absolute Value tables to Excel and do a comparison in Excel.
This dialog can be opened by selecting the "Reports" option from the main menu or by doing the following in the Tree Control Window:
- Right click one of the nodes at the Root level or one of the Projects.
- Select "Reports" from the "Project" menu. The "Reports" dialog will open to the "General" tab.
- Click on the "Comparison Graphs " tab.
Procedure for Comparing Two or More Projects:
- Select two or more projects from the list of open projects.
- Select one or more "Summary Measures" to compare. Select the "All Values" if you want to generate all "Summary Measure" comparison graphs.
- Select the report results "Format" ("Absolute Value", "Per Unit Area", or "Project Baseline"). (If you wish to use one of the selected projects as a baseline, you can pick it from the "Project Baseline" selection list.)
- Select the report "Type" ("Life Cycle Stage", "Assembly Groups").
- Click the "Show Reports" button.
List of the Multi-Project Summary Measure Comparison Graph Reports the Pavement LCA is capable of generating:
 Absolute Value by Assembly Group
- Acidification Potential – Multi-Project Comparison Graph of Absolute Value by Assembly Group
- Global Warming – Multi-Project Comparison Graph of Absolute Value by Assembly Group
- HH Criteria – Multi-Project Comparison Graph of Absolute Value by Assembly Group
- Ozone Depletion Potential – Multi-Project Comparison Graph of Absolute Value by Assembly Group
- Smog Potential – Multi-Project Comparison Graph of Absolute Value by Assembly Group
- Fossil Fuel Consumption – Multi-Project Comparison Graph of Absolute Value by Assembly Group
- Eutrophication Potential – Multi-Project Comparison Graph of Absolute Value by Assembly Group
Absolute Value by Life Cycle Stage
- Total Primary Energy – Multi-Project Comparison Graph of Absolute Value by Life Cycle Stage
- Non-Renewable Primary Energy – Multi-Project Comparison Graph of Absolute Value by Life Cycle Stage
- Fossil Fuel Consumption – Multi-Project Comparison Graph of Absolute Value by Life Cycle Stage
- Acidification Potential – Multi-Project Comparison Graph of Absolute Value by Life Cycle Stage
- Global Warming Potential – Multi-Project Comparison Graph of Absolute Value by Life Cycle Stage
- HH Criteria – Multi-Project Comparison Graph of Absolute Value by Life Cycle Stage
- Ozone Depletion Potential – Multi-Project Comparison Graph of Absolute Value by Life Cycle Stage
- Smog Potential – Multi-Project Comparison Graph of Absolute Value by Life Cycle Stage
- Eutrophication Potential – Multi-Project Comparison Graph of Absolute Value by Life Cycle Stage
Per Unit Area by Assembly Group
- Acidification Potential – Multi-Project Comparison Graph per Unit Area by Assembly Group
- Global Warming Potential – Multi-Project Comparison Graph per Unit Area by Assembly Group
- HH Criteria – Multi-Project Comparison Graph per Unit Area by Assembly Group
- Ozone Depletion Potential – Multi-Project Comparison Graph per Unit Area by Assembly Group
- Smog Potential – Multi-Project Comparison Graph per Unit Area by Assembly Group
- Fossil Fuel Consumption – Multi-Project Comparison Graph per Unit Area by Assembly Group
- Eutrophication Potential – Multi-Project Comparison Graph per Unit Area by Assembly Group
Per Unit Area by Life Cycle Stage
- Total Primary Energy – Multi-Project Comparison Graph per Unit Area by Life Cycle Stage
- Non-Renewable Primary Energy – Multi-Project Comparison Graph per Unit Area by Life Cycle Stage
- Fossil Fuel Consumption – Multi-Project Comparison Graph per Unit Area by Life Cycle Stage
- Acidification Potential – Multi-Project Comparison Graph per Unit Area by Life Cycle Stage
- Global Warming Potential – Multi-Project Comparison Graph per Unit Area by Life Cycle Stage
- HH Criteria – Multi-Project Comparison Graph per Unit Area by Life Cycle Stage
- Ozone Depletion Potential – Multi-Project Comparison Graph per Unit Area by Life Cycle Stage
- Smog Potential – Multi-Project Comparison Graph per Unit Area by Life Cycle Stage
- Eutrophication Potential – Multi-Project Comparison Graph per Unit Area by Life Cycle Stage
On a Percent Basis Relative to a Baseline Project by Assembly Group
- Acidification Potential – Multi-Project Comparison Graph on a Percent Basis Relative to a Baseline Project by Assembly Group
- Global Warming Potential – Multi-Project Comparison Graph on a Percent Basis Relative to a Baseline Project by Assembly Group
- HH Criteria – Multi-Project Comparison Graph on a Percent Basis Relative to a Baseline Project by Assembly Group
- Ozone Depletion Potential – Multi-Project Comparison Graph on a Percent Basis Relative to a Baseline Project by Assembly Group
- Smog Potential – Multi-Project Comparison Graph on a Percent Basis Relative to a Baseline Project by Assembly Group
- Fossil Fuel Consumption – Multi-Project Comparison Graph on a Percent Basis Relative to a Baseline Project by Assembly Group
- Eutrophication Potential – Multi-Project Comparison Graph on a Percent Basis Relative to a Baseline Project by Assembly Group
On a Percent Basis Relative to a Baseline Project by Life Cycle Stage
- Total Primary Energy – Multi-Project Comparison Graph on a Percent Basis Relative to a Baseline Project by Life Cycle Stage
- Non-Renewable Primary Energy ndash; Multi-Project Comparison Graph on a Percent Basis Relative to a Baseline Project by Life Cycle Stage
- Fossil Fuel Consumption – Multi-Project Comparison Graph on a Percent Basis Relative to a Baseline Project by Life Cycle Stage
- Acidification Potential – Multi-Project Comparison Graph on a Percent Basis Relative to a Baseline Project by Life Cycle Stage
- Global Warming Potential – Multi-Project Comparison Graph on a Percent Basis Relative to a Baseline Project by Life Cycle Stage
- HH Criteria – Multi-Project Comparison Graph on a Percent Basis Relative to a Baseline Project by Life Cycle Stage
- Ozone Depletion Potential – Multi-Project Comparison Graph on a Percent Basis Relative to a Baseline Project by Life Cycle Stage
- Smog Potential – Multi-Project Comparison Graph on a Percent Basis Relative to a Baseline Project by Life Cycle Stage
- Eutrophication Potential – Multi-Project Comparison Graph on a Percent Basis Relative to a Baseline Project by Life Cycle Stage
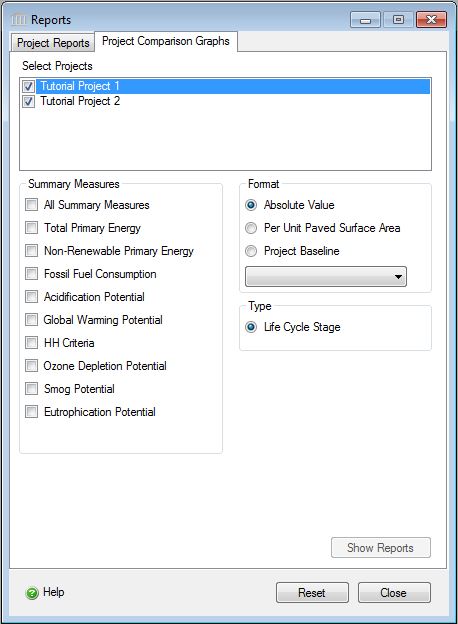
The available options include:
- Select Projects
- A list of all currently open projects will appear in the "Select Projects" box. Double click the project names in this box to select them for comparison.
Summary Measures- Click on the check box next to the Summary Measure that you want to compare the projects across. You may select more than one. Alternatively, the user may select the "All Measures" box to display a comparison of all measures in a single graph.
Format- Here you can pick a graph format basis for comparison.
- Absolute Value
- Selecting the "Absolute Value" button invokes a comparison of the selected Summary Measures on the basis of the absolute results for the selected projects. This comparison works best for comparing similar designs (e.g., projects with the same functional roadway) across different material types (e.g., an asphalt design and a concrete design for the same roadway)
- Per Unit Paved Surface Area
- Selecting the "Per Unit Paved Surface Area" graph format invokes a comparison on the basis of square meters of paved roadway surface area as calculated from the "Roadway Paved Surface Area" design details and displayed in the "General" tab of the Add/Modify Project dialog box for the projects being compared. This comparison works best for similar roadway designs with varying paved roadway surface areas.
- Project Baseline
- Selecting the "Project Baseline" graph format invokes a comparison using one of the selected projects as the benchmark (baseline) and displays the relative percent difference of the other selected projects. To select a particular project as the baseline benchmark just highlight it in the "Selected Projects" list by clicking on it once. Otherwise, the Pavement LCA will select the first project in the "Selected Project" list and make it the baseline project for the relative comparison.
Type-
Here you can select whether the comparison graphs to be displayed will be by life cycle stages or by assembly groups.
- Life Cycle Stages
- Selecting "Life Cycle Stages" generates a graph type showing a comparison of the selected projects for the summary measure of interest across the life cycle stages. The life cycle stages are defined as manufacturing, construction, operation, maintenance, and annual operation.
- Assembly Group Embodied Effects
- Selecting the "Assembly Groups" generates a graph type showing a comparison of the selected projects for the summary measure of interest across assembly groups. The report may have as many as 6 assembly groups (extra basic materials, floors, roofs, columns & beams, walls, and foundations). The graph will also display the total effect for all assemblies across the projects being compared. This graph type does not include operating energy effects.
Show Reports Button- Selecting this button will result in the requested report format and content to be generated for each of the summary measures that you selected.
Reset Button- Selecting this button will cause the "Reports" dialog "Comparison Graphs" tab form options to be reset to their default state.
Close Button- Selecting this button will close the "Reports" dialog.