Air Emissions – Absolute Value Graph by Life Cycle Stages
Note:
The column values on the Absolute Value graphs for Air Emissions and Water Emissions were unreadable in the Version 4.0 release.
These graphs have been disabled for the Version 4.1 release.
Users are advised to use the Table version of these reports.
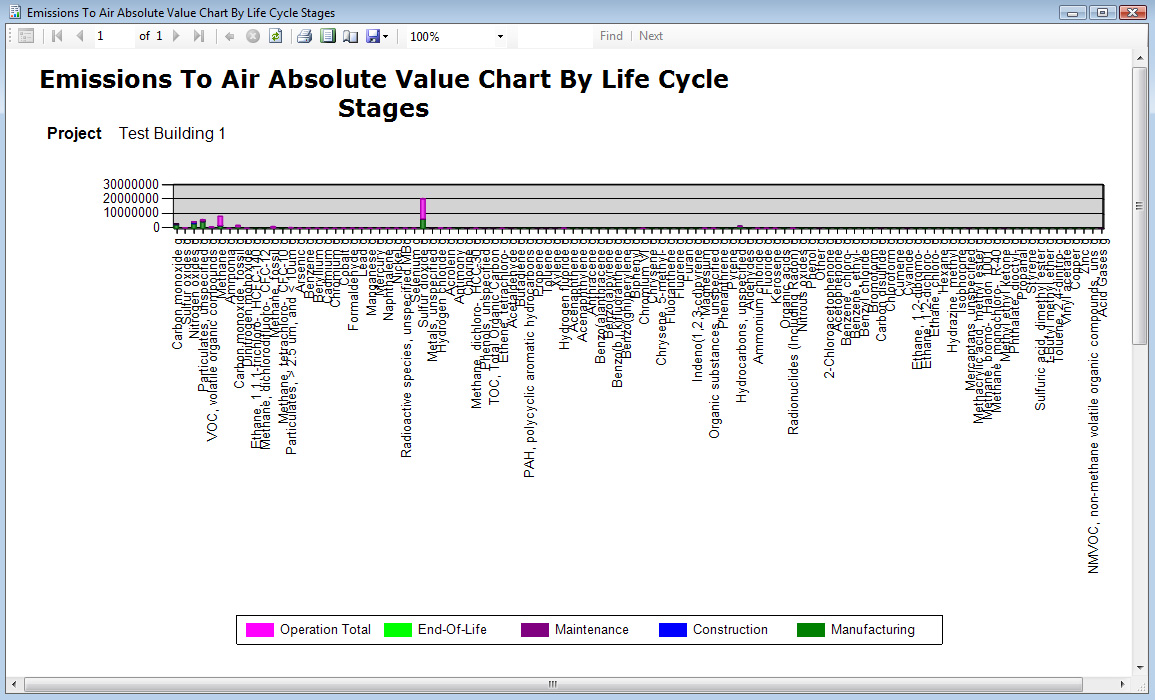
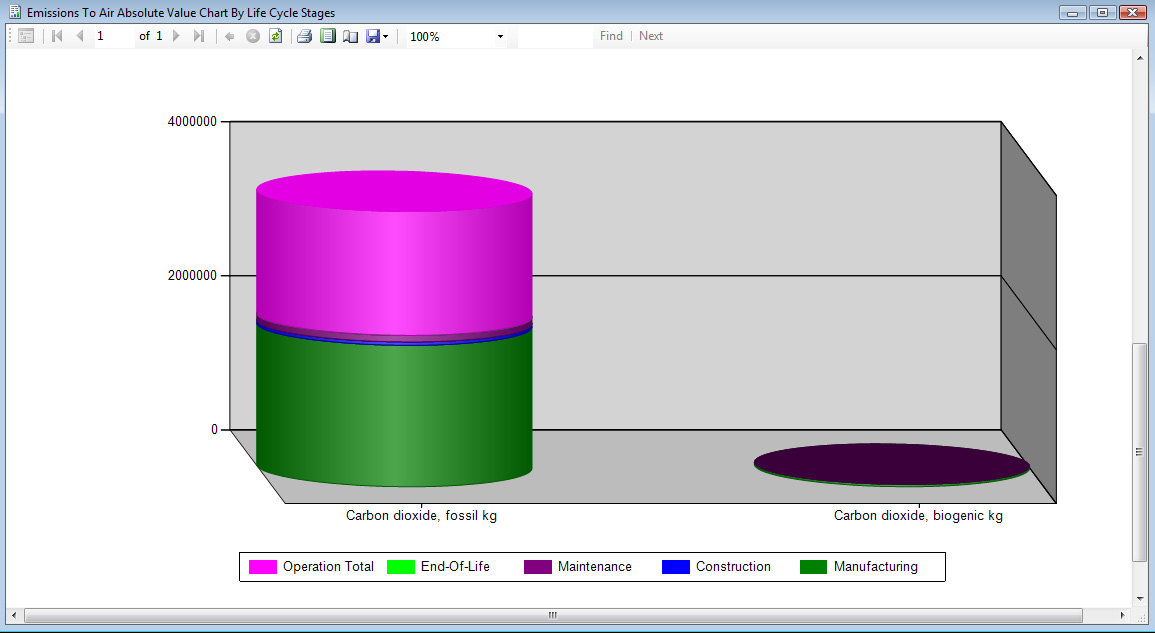
This set of graphs displays the emissions to air for each air emission type by life cycle stage inclusive of structural and envelope effects as well as annual operating energy. The report is broken into two graphs: the first graph displays all air emission absolute values by type, excluding CO2 and biomass CO2 air emissions; the second graph displays CO2 and biomass CO2 emission values as well as the Total air emissions by assembly group.
Life Cycle Stage Definitions:
Manufacturing:- Includes resource extraction, resource transportation and manufacturing of specific materials, products or roadway components;
Construction:- Includes product/component transportation from the point of manufacture to the construction site and on-site construction activities;
Maintenance:- Includes life cycle maintenance and replacement activities associated with the structure and envelope components based on roadway type, location and a user defined life for the roadway project
Embodied Totals:- Includes life cycle effects due to Manufacturing, Construction adn Maintenance life cycle stages.
Use Phase: Roadway Operating Energy:- Includes life cycle operating energy
Use Phase: Excess Fuel Consumption tue to PVI:- Includes the projected excess fuel consumption due to Pavement Vehicle Interaction.
Roadway "End-of-Life":- Simulates demolition energy and final disposition of the materials incorporated in a roadway at the end of the roadway life. Since roadways are assumed to never really have an end of life scenario, no effects are calculated for demolition.