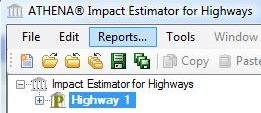
Reports Menu

The reports menu opens the "Reports" dialog. This menu is only accessible when one or more projects are open.
The "Reports" dialog has two tabs, "General" and "Comparison Graphs ".
The form on the "General" tab provides the user with options for generating one or more reports using either the absolute inventory results or the eight aggregated summary impact measures (e.g. - Fossil Fuel Consumption, Air Acidification, Global Warming Potential, Human Health Criteria, Ozone Depletion Potential, Smog Potential, Eutrophication Potential) as a graph or table. This form can also be used to generate a "Bill of Materials" report.
The form on the "Comparison Graphs " tab provides the user with options for generating one or more summary measure project-to-project comparison graph reports.
All Table and Graph reports use a "Report Viewer", that has a common toolbar. Each member of the common toolbar is detailed in the "Report Toolbar" page.