|
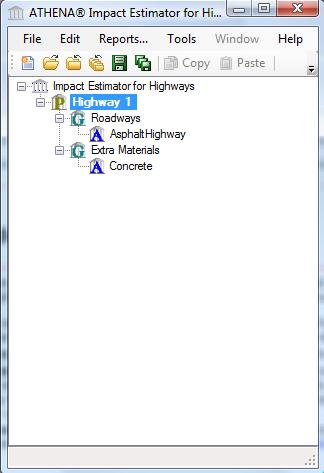
The Pavement LCA Tree Control Window is the easiest and most
convienent method of tracking and manipulating projects and their
contents. The tree control displays all opened projects and their
contents in an easy to use hierarchy. There are four (4) layers to the
hierarchy as follows:
- The Root node - This is the
topmost (root control) node of the tree. It allows the user access to
all of the system-wide functions such as adding new projects. The
available operations relate to projects and are accessed by right-clicking on the root node.
- The Project node - Each open project will be displayed at this level. The available operations are accessed by right-clicking on the project node.
- The Assembly Group node
- The nodes for the assembly groups will be displayed at this level.
The assembly groups are Foundations, Walls, Columns and Beams, Floors,
Roofs, and Extra Basic Materials. There will only be a node for a given
assembly group if at least one assembly belonging to that group has
already been added to the project. The available assembly Group
operations are accessed by right-clicking on the assembly group node.
- The Assembly node
- Each assembly that has been added to the project will be shown in
group beneath the node for the appropriate Group. The assembly oriented
operations are accessed by right-clicking on the assembly node.
Customizing the Athena tree control display
The display format of the Pavement LCA Tree Control can be changed
in order to provide the user with the ability to quickly get limited
information about the effects of the project by merely looking at the
tree control. This feature allows a summary of one of the summary measures
to be displayed. Beside each of the items in the tree control (except
the root node) the value for the chosen summary measure will be
displayed. There are several steps that can be followed to enable this
feature.
- Select the format to display the values. Right-click on the root node and select the "Select Percent or Value on Tree" item, then select how you want to see the summary measure displayed.
- Percentage - The value will be displayed as a percentage of the value that the item contributes to its parent.
- Value - An absolute value representing the summary value for the chosen summary measure type.
- Select the summary measure to display. Right-click on the root node and select the "Select Summary Measure for Tree" item, then select the desired summary measure.
It is important to note that the tree only shows embodied effects due to the assemblies and not operating effects.
- Acidification Potential:
selecting this item displays the "Air Acidification" index for each
item in the Tree Control Window as either a percent of the project or
as an absolute contribution to the project.
- Eutrophication Potential:
selecting this item displays the "Eutrophication Potential" index for
each item in the Tree Control Window as either a percent of the project
or as an absolute contribution to the project.
- Fossil Fuel Consumption:
selecting this item displays "Fossil Fuel Consumption" for each item in
the Tree Control Window as either a percent of the project or as an
absolute contribution to the project.
- Global Warming Potential:
selecting this item displays the "Global Warming" index for each item
in the Tree Control Window as either a percent of the project or as an
absolute contribution to the project.
- Human Health Criteria:
selecting this item displays the "HH Criteria"
index for each item in the Tree Control Window as either a percent of
the project or as an absolute contribution to the project.
- Ozone Depletion Potential:
selecting this item displays the "Ozone Depletion" index for each item
in the Tree Control Window as either a percent of the project or as an
absolute contribution to the project.
- Smog Potential:
selecting this item displays the "Smog" index for each item in the Tree
Control Window as either a percent of the project or as an absolute
contribution to the project.
- Display the summary measure. Right-click on the root node and select the "Show Summary Measure on Tree " item.
Note: Operational energy effects will not be displayed as summary measures.
|