Eutrophication Potential – Summary Measure Graph by Life Cycle Stage
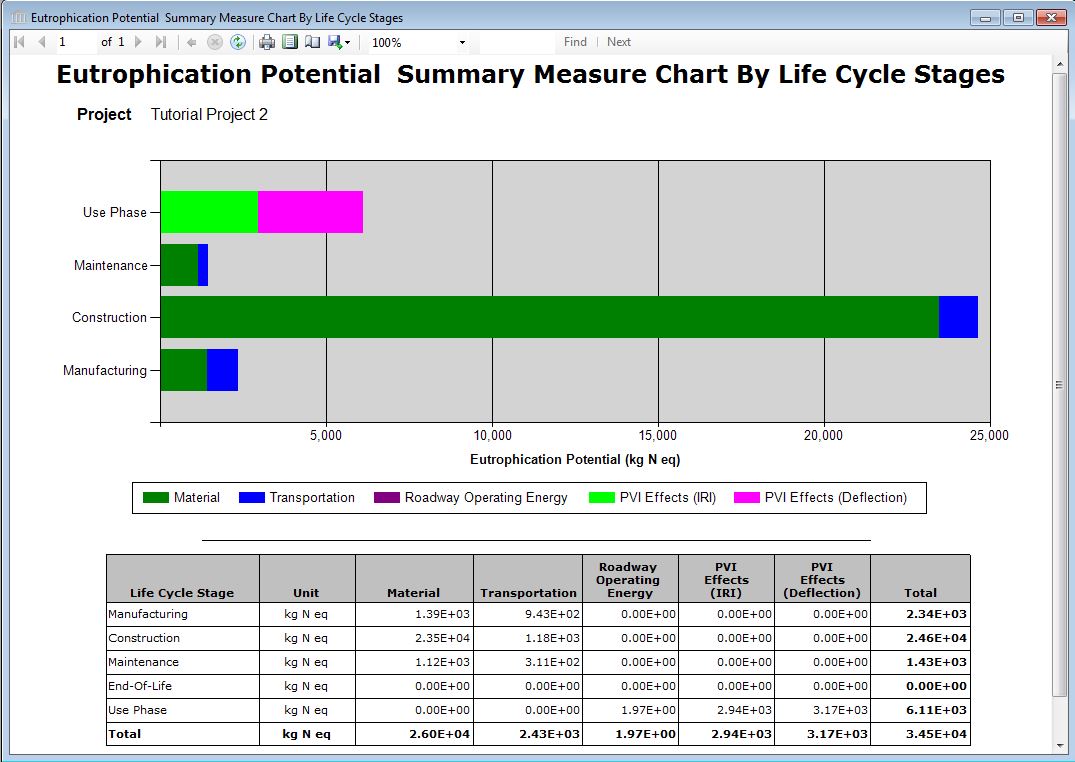
This graph displays the Eutrophication Potential Index results by life cycle stages. Each life cycle stage is further broken down into Water Eutrophication Index contributions of materials, transportation and annual operating energy. A total Eutrophication Potential Index effect is also provided for the project desegregated on the basis of sub-group contribution over the expected life of the project, but only includes one year of operating energy.
Life Cycle Stage Definitions:
Manufacturing:- Includes resource extraction, resource transportation and manufacturing of specific materials, products or roadway components;
Construction:- Includes product/component transportation from the point of manufacture to the construction site and on-site construction activities;
Maintenance:- Includes life cycle maintenance and replacement activities associated with the structure and envelope components based on roadway type, location and a user defined life for the roadway project
Embodied Totals:- Includes life cycle effects due to Manufacturing, Construction adn Maintenance life cycle stages.
Use Phase: Roadway Operating Energy:- Includes life cycle operating energy
Use Phase: Excess Fuel Consumption tue to PVI:- Includes the projected excess fuel consumption due to Pavement Vehicle Interaction.
Roadway "End-of-Life":- Simulates demolition energy and final disposition of the materials incorporated in a roadway at the end of the roadway life. Since roadways are assumed to never really have an end of life scenario, no effects are calculated for demolition.
All Table and Graph reports use a "Report Viewer", that has a common toolbar. Each member of the common toolbar is detailed in the "Report Toolbar" page.
Sub-Group Definitions:
- Material:
- Includes all effects due to material production or use.
Transportation:- Includes all effects associated with moving materials.
Annual Op.Energy- Includes all effects associated with annual operating energy as specified by the user of the application.
All Table and Graph reports use a "Report Viewer", that has a common toolbar. Each member of the common toolbar is detailed in the "Report Toolbar" page.