Generate Reports - Summary Measure Graphs
The "Reports" dialog "General" tab provides the user with options for generating one or more reports using the the eight aggregated summary impact measures (e.g. - Fossil Fuel Consumption, Air Acidification, Global Warming Potential, Human Health Criteria, Ozone Depletion Potential, Smog Potential, Eutrophication Potential) as a graph.
,This dialog can be opened by selecting the "Reports" option from the main menu or by doing the following in the Tree Control Window:
- Right click one of the nodes at the Root level or one of the Projects.
- Select "Reports" from the "Project" menu. The "Reports" dialog will open to the "General" tab.
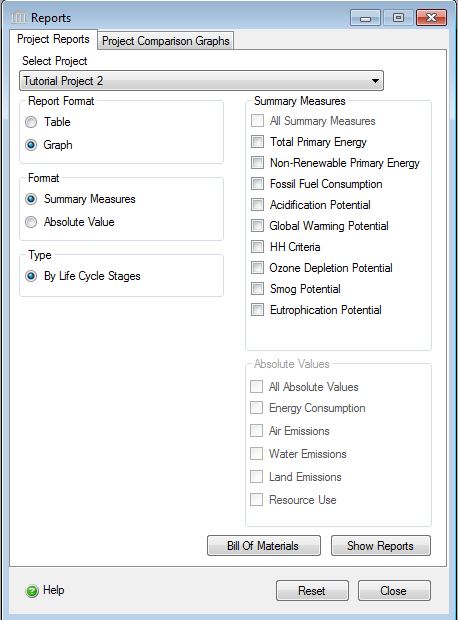
Procedure for Generating Reports:
- Select a Project
- Select a Report Format ("Graph").
- Select a report results Format ("Summary Measures ").
- Select the Report Type ("Life Cycle Stages", "Assembly Group Embodied Effects", "Operating vs. Embodied" ).
- Select one or more of the "Summary Measure" effects.
- Click on the "Show Reports" button to generate the requested report(s).
List of the Absolute Value Graph Reports the Pavement LCA is capable of generating for each Project:
Summary Measure Graphs by Assembly Group
- Acidification Potential – Summary Measure Graph by Assembly Group
- Global Warming Potential – Summary Measure Graph by Assembly Group
- HH Criteria – Summary Measure Graph by Assembly Group
- Ozone Depletion Potential – Summary Measure Graph by Assembly Group
- Smog Potential – Summary Measure Graph by Assembly Group
- Fossil Fuel Consumption – Summary Measure Graph by Assembly Group
- Eutrophication Potential – Summary Measure Graph by Assembly Group
Summary Measure Graphs by Life Cycle Stage
- Total Primary Energy – Summary Measure Graph by Life Cycle Stage
- Non-Renewable Primary Energy – Summary Measure Graph by Life Cycle Stage
- Fossil Fuel Consumption – Summary Measure Graph by Life Cycle Stage
- Acidification Potential – Summary Measure Graph by Life Cycle Stage
- Global Warming Potential – Summary Measure Graph by Life Cycle Stage
- HH Criteria – Summary Measure Graph by Life Cycle Stage
- Ozone Depletion Potential – Summary Measure Graph by Life Cycle Stage
- Smog Potential – Summary Measure Graph by Life Cycle Stage
- Eutrophication Potential – Summary Measure Graph by Life Cycle Stage
Summary Measure Graphs Comparing Total Operating with Embodied Effects
The available options include:
- Report Format
- Here you can specify whether you want the report to be presented as either a graph or table.
Format- Here you can specify whether you want the report results to be based on "Absolute Values" or "Summary Measures".
- Absolute Value
- Selecting this option will enable the "Absolute Values" section of the "Reports" dialog. You will then be able to specify which absolute values you wish to include in the report.
- Summary Measures
- Selecting this option will enable the "Summary Measures" section of the "Reports" dialog. You will then be able to specify which summary measures you wish to include in the report.
Type-
Here you can specify which type of report you want to generate.
- Life Cycle Stages
- Selecting this option displays the summary results for the selected Project to be broken into material, transportation related and annual operating effects by life cycle stage. Specifically the roadway project life cycle stages contained in the graph include: manufacturing, construction, operations and maintenance, and end-of-life.
- Assembly Group Embodied Effects
- Selecting this option displays the results for the selected Project to be broken into effects by assembly group. The report may have as many as 6 assembly groups (extra basic materials, floors, roofs, columns & beams, walls, and foundations). This graph type does not include operating energy effects.
- Operating Vs Embodied
- This option is only available when the Report Format is "Graph" and the Format is "Summary Measures". The resulting graph(s) compare the total operating energy for the roadway project throughout its life span with the embodied energy of its materials.
Summary Measures- Here you can select one or more of the eight available summary measures to report on including Fossil Fuel Consumption, Air Acidification, Global Warming Potential, Human Health Criteria, Ozone Depletion Potential, Smog Potential, Eutrophication Potential.
Absolute Values- Here you can selected one or more of the five absolute value options to report on including Energy Consumption, Air Emissions, Water Emissions, Land Emissions, and Resource Use.
Bill of Materials Button- Selecting this button will open result in the Bill of Materials report being generated.
Show Reports Button- Selecting this button will result in the requested report format and content to be generated for each of the summary measures or absolute value options that you selected.
Reset Button- Selecting this button will cause the "Reports" dialog "General" tab form options to be reset to their default state.
Close Button- Selecting this button will close the "Reports" dialog.