LCA Measure – Multi-Project Comparison Graph per Unit Area by Assembly Group
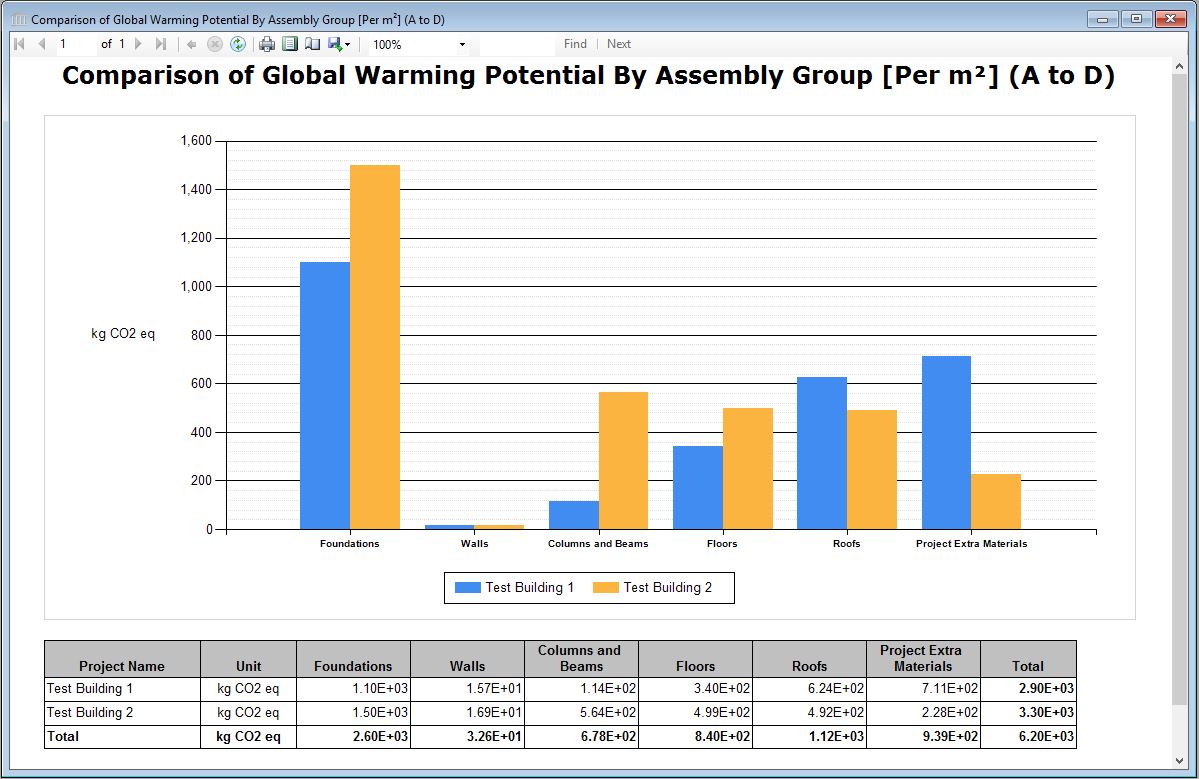
This graph compares the absolute value of the selected LCA Measure across selected projects by assembly groups on a floor area basis. A per floor area total bar for all assembly groups is also provided across the projects being compared. Each project’s floor area is determined from the user provided floor area entered in the "Add or Modify Project" dialog. Values are presented on a per m2 or a per ft2 basis and this is determined by the application Default Units selection (SI (Metric) or Imperial) in the Tools>Options menu. The Units selection of any individual project that is being compared will have NO effect on the per unit area unit of these graphs. This graph presents the embodied effects only (operational energy effects are not included). The image shown here is for Global Warming Potential, but the format also applies to all of the LCA Measures:
- Global Warming Potential
- Acidification Potential
- HH Particulate
- Eutrophication Potential
- Ozone Depletion Potential
- Smog Potential
- Total Primary Energy Consumption
- Non-Renwable Energy Consumption
- Fossil Fuel Consumption
A minimum of two, to a maximum of five, projects may be compared in any given comparison graph. Each project is displayed side-by-side.
Assembly Group Definitions:
- Extra Material
- Include all structural and envelope materials defined via the "Extra Basic Material" assembly for the project building.
Floors:- Include all structural materials defined as a floor assembly for the project building.
Roofs:- Include all structural materials defined as roof assembly for the project building.
Columns & Beams:- Include all structural materials defined as a column and beam assembly for the project building.
Walls:- Include all structural materials defined as a wall assembly for the project building.
Foundations:- Include all structural materials defined as a foundation assembly for the project building.
All Table and Graph reports use a "Report Viewer", that has a common toolbar. Each member of the common toolbar is detailed in the "Report Toolbar" page.