Rating System Comparison Reports - Green Globes
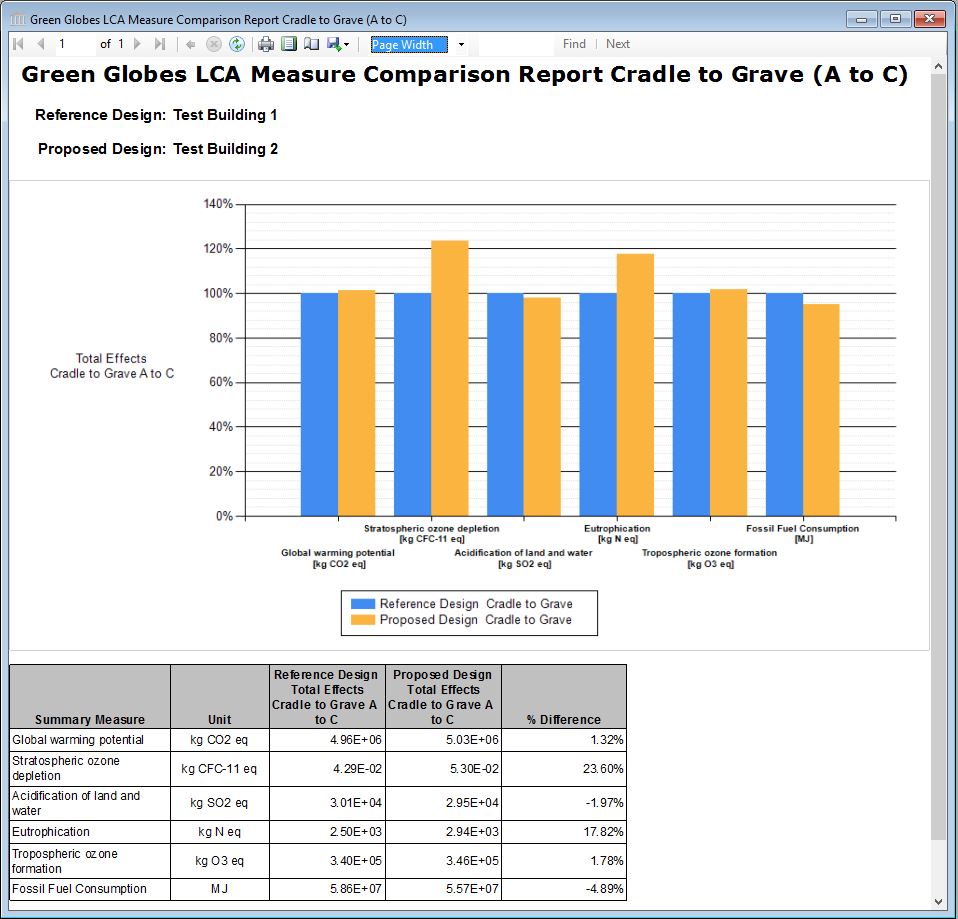
Comparison Reports present a table of LCA Measures required by the rating system, for two buildings, a Reference and a Proposed design, and the percent difference between the two. The total effects include embodied and operating energy effects, and the user can choose his or her system boundary, A to C or A to D, according to the EN 15804/15978 reporting format. For further explanation of Modules A to D, click here. The image above shows a sysem boundary of modules A to C, but the A to D table is in the same format.
The percentage difference is calculated as (Reference Design - Proposed Design) / Reference Design.
The table and graph can be exported to Excel or PDF for inclusion in a rating system submission (for Excel, the table is exported as a table, but the graph is exported as a jpg picture).
This table displays the LCA Measure results prescribed by Green Globes:
- Global Warming Potential
- Acidification Potential
- Eutrophication Potential
- Ozone Depletion Potential
- Smog Potential
- Fossil Fuel Consumption
All Table and Graph reports use a "Report Viewer", that has a common toolbar. Each member of the common toolbar is detailed in the "Report Toolbar" page.