LCA Measure Multi-Project Comparison Graph by Assembly Group - Absolute Value
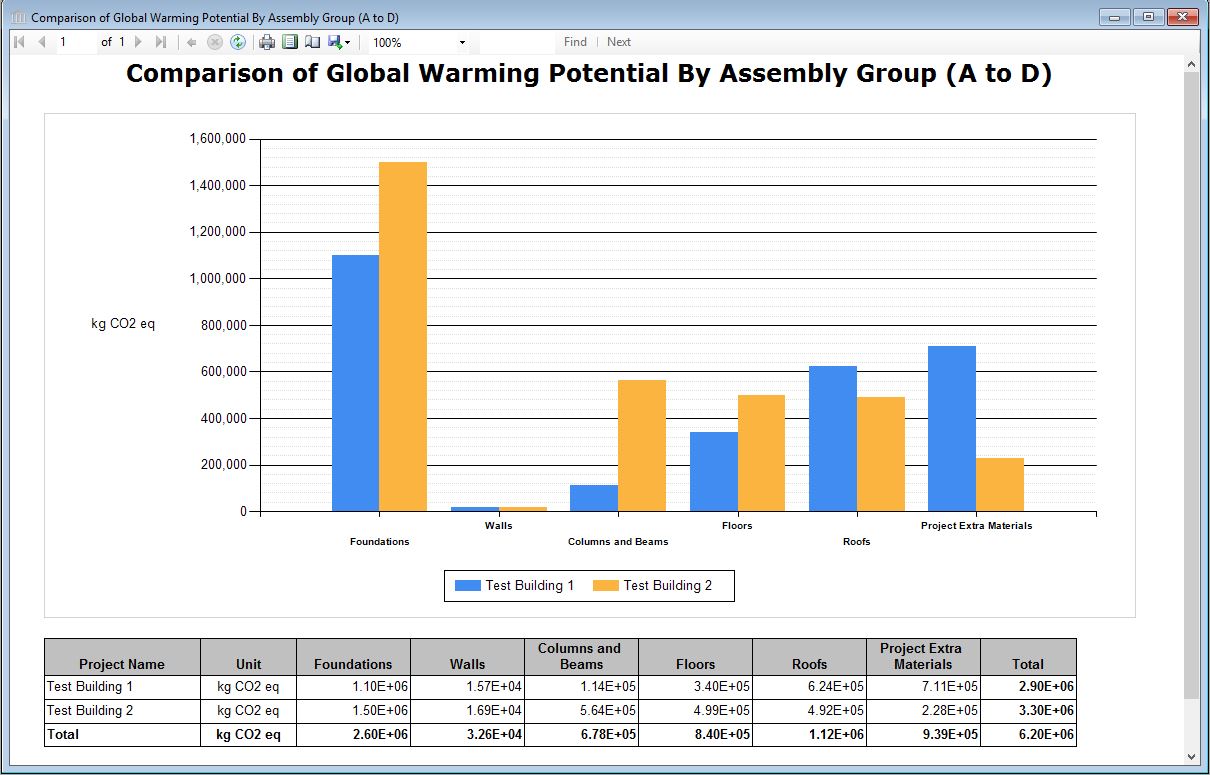
This graph compares the selected LCA Measure across selected projects by assembly groups on an absolute value basis. This graph presents the embodied effects only (operational energy effects are not included).The image shown here is for Global Warming Potential, but the format also applies to all of the LCA Measures:
- Global Warming Potential
- Acidification Potential
- HH Particulate
- Eutrophication Potential
- Ozone Depletion Potential
- Smog Potential
- Total Primary Energy Consumption
- Non-Renwable Energy Consumption
- Fossil Fuel Consumption
A minimum of two, to a maximum of five, projects may be compared in any given comparison graph. Each project is displayed side-by-side.
Note: This graph does not consider nor displays Global Warming Potential effects associated with operating energy. Also, these graphs show the results for modules A to D of the EN 15804/15978 reporting format. For further explanation of Modules A to D, click here.
Assembly Group Definitions:
- Extra Material
- Include all structural and envelope materials defined via the "Extra Basic Material" assembly for the project building.
Floors:- Include all structural materials defined as a floor assembly for the project building.
Roofs:- Include all structural materials defined as roof assembly for the project building.
Columns & Beams:- Include all structural materials defined as a column and beam assembly for the project building.
Walls:- Include all structural materials defined as a wall assembly for the project building.
Foundations:- Include all structural materials defined as a foundation assembly for the project building.
All Table and Graph reports use a "Report Viewer", that has a common toolbar. Each member of the common toolbar is detailed in the "Report Toolbar" page.